Okay it’s occur to me how i can monitor the specific process that happen on apache server, yes we can use top, ps aux , lsof etc command to monitor the process but we can only see a general info on it. And i found mod_status.
What is mod_status ?
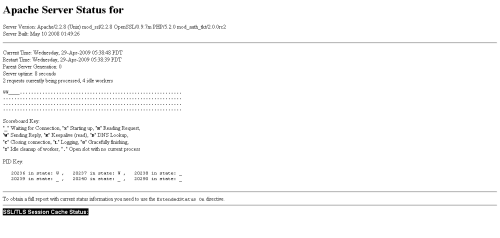
mod_status is a built in Apache web server modules (by default) and with that we can get server status from a web browser. With this module you can easily find out how well your server is preforming. All reports are generated in a html format. You can easily find out following type of information:
- Total number of worker serving requests
- Total number of of idle worker
- Find the status of each worker, the number of requests that worker has performed and the total number of bytes served by the worker
- Total number byte count served
- Other information such as CPU usage, number of requests per second,current hosts and requests being processed etc.
Setting the mod_status
Btw i use CentOS release 5.3 (Final) , httpd-manual-2.2.3-11.el5_1.centos.3 and httpd-2.2.3-11.el5_1.centos.3 for this tutorial. Okay let’s start the set up:
1. Go to httpd.conf or /apache2.conf on /etc/httpd/conf/httpd.conf or /etc/apache2/apache2.conf and add this
<Location /server-status>
SetHandler server-status
Order deny,allow
Deny from all
Allow from .your_domain.com
</Location>
it means :
server status will be acessible at location http://servername/server-status, access will be denied to everybody but people connecting from domain your_domain.com and any sub-domain from your_domain.com.
you could be using localhost instead of 127.0.0.1 for the only access for your http://servername/server-status. here is the settings:
<Location /server-status>
SetHandler server-status
Order deny,allow
Deny from all
Allow from 127.0.0.1
</Location>
If you did not want any resctriction you can set allow from all like this:
<Location /server-status>
SetHandler server-status
Order deny,allow
Allow from all
</Location>
2. Check your configuration and restart the settings
# service httpd restart
3. Access your server-status on your http://servername/server-status
3. You will see a standard info on the server-status, If you want to get more information from your server activity, you can add this on your httpd.conf/apache2.conf:
just above the <Location /server-status> directive. But keep in mind that this cannot be set on a per virtualhost basis and will use more resources.
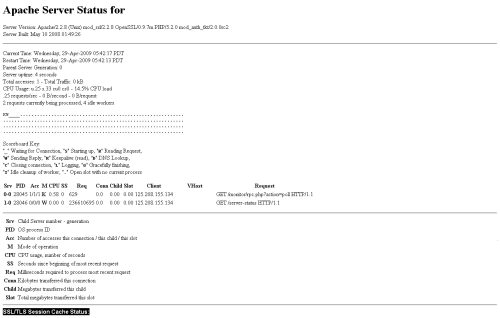
But in another hand, you will be able to access more informations such as:
- Total accesses
- CPU usage
- number of requests/sec, Bytes/sec and Bytes/request
- See the different clients connected to your server, on which virtual host as well as the page there are requesting, you can even access the time it took to request a specific page as well as the resources required.
Then don’t forget to restart the httpd /apache service
# service httpd restart
and you will see more info
and one more thing You can get the status page to update itself automatically if you have a browser that supports “refresh”. Access the page http://servername/server-status?refresh=N to refresh the page every N seconds.
http://localhost/server-status?refresh=2
Here is the detail info of the http://servername/server-status
Apache Server Status for somedomain.com
Server Version: Apache/1.3.9 (Unix) PHP/4.0b3
Server Built: Mar 4 2000 17:01:01
The first few lines identify and provide a brief description of your server. The server version information includes an incomplete list of some of the modules compiled into your server. Our example server is running on a Unix system and has been compiled with support for the PHP scripting language. (The level of detail provided by the server version line may be limited by theServerTokens configuration directive.)
Current Time: Thursday, 13-Apr-2000 17:22:36 PDT
Restart Time: Thursday, 13-Apr-2000 17:15:26 PDT
Parent Server Generation: 14
Server uptime: 7 minutes 10 seconds
Total accesses: 42 - Total Traffic: 187 kB
CPU Usage: u.1 s.1 cu0 cs0 - .0465% CPU load
.0977 requests/sec - 445 B/second - 4559 B/request
3 requests currently being processed, 5 idle servers
The next block represents the server’s current state. Our example server has only been up for a few minutes and hasn’t yet seen much activity. It is currently dealing with three requests, one of which is my request for the server status itself. The message that five servers are idle servers is a clue that this server is configured to maintain a pool of at least five spare child processes ready to spring into action should the need arise.
K___K_W_........................................................
................................................................
................................................................
................................................................

Scoreboard Key:
   "_" Waiting for Connection, "S" Starting up, "R" Reading Request,
   "W" Sending Reply, "K" KeepAlive (read), "D" DNS Lookup, "L" Logging,
   "G" Gracefully finishing, "." Open slot with no current process
No, that’s not boring morse-code; it’s the “scoreboard,” a pseudo-graphical representation of the state of the server’s child processes. According to the included Scoreboard Key, our server is replying to one request, maintaining two KeepAlive connections, and is maintaining five idle processes. A busier server’s scoreboard would look more like:
WWKW__WW_KKKWK__KKKKWKKKKK_WKKK_KK__KRWKKK__KK___K____WKK__KWWKK
_K___K___WWKWWW_W_W_WWWK_WW_WWWLWWW_KWWKKWKWWKWWKKWW_KWKKKKW__WK
WKWWW_KKWKKKWK_KW_KKKK__KK_KKKWWK_KW__K_KKK_K..........W........
................................................................
For more on pool regulation and KeepAlive, see my earlier HTTP Wrangler column, “An Amble Through Apache Configuration.”
Srv  PID   Acc     M CPU  SS Req Conn Child Slot
0-14 29987 0/24/24 W 0.09 2  0   0.0  0.16  0.16

Client     VHost Request     Request
127.0.0.1  www.mydomain.net  GET /server-status HTTP/1.0
In addition to a more general overview of your server’s activity, mod_status gets down to the nitty-gritty, displaying a snapshot of the individual requests it is currently handling. Let’s take a gander at a fairly representative request. Please note that the output above has been split in half for display purposes.
| 0-14 | Srv The ID of the child process and its generation. The generation increases each time a child process is restarted, whether due to a server-restart or a limit placed on the number of processes a child is allowed to handle. See the MaxRequestsPerChild directive. |
| 29987 | PID The child’s process ID. |
| 0/24/24 | Acc The first number in this trio is the number of accesses or requests using this connection. For non-KeepAlive connections, this will be 0 since each request makes its own connection and so is always the first (and last). The second is the number of requests handled thus far by this child. The third is the number of requests handled by this slot; the child may have come and gone, its slot taken by another. |
| W | Mode The child’s mode of operation; one of the following possibilities:
“_” Waiting for Connection, “S” Starting up, “R” Reading Request, “W” Sending Reply, “K” KeepAlive (read), “D” DNS Lookup, “L” Logging, “G” Gracefully finishing, “.” Open slot with no current process |
| 0.09 2 0 0.0 0.16 0.16 |
CPU SS Req Conn Child Slot Some of the less useful bits and pieces…
CPU: The child’s CPU usage in number of seconds. |
| www.mydomain.net | VHost Perhaps your server hosts multiple virtual domains; how would you determine which page is being requested by GET /index.html?. The VHost column helps you sort out which request is coming to which virtual host — in this example, www.mydomain.net. |
| GET /server-status HTTP/1.0 | Request This particular hit is my request for server-status. The GET bit indicates a simple request for a document (as opposed to sending data to the server using POST). The browser (in this case the Unix command-line wget program) is using HTTP version 1.0.
For more on HTTP, see my earlier HTTP Wrangler column, “Introducing Apache.” |

